Key Findings of the Report
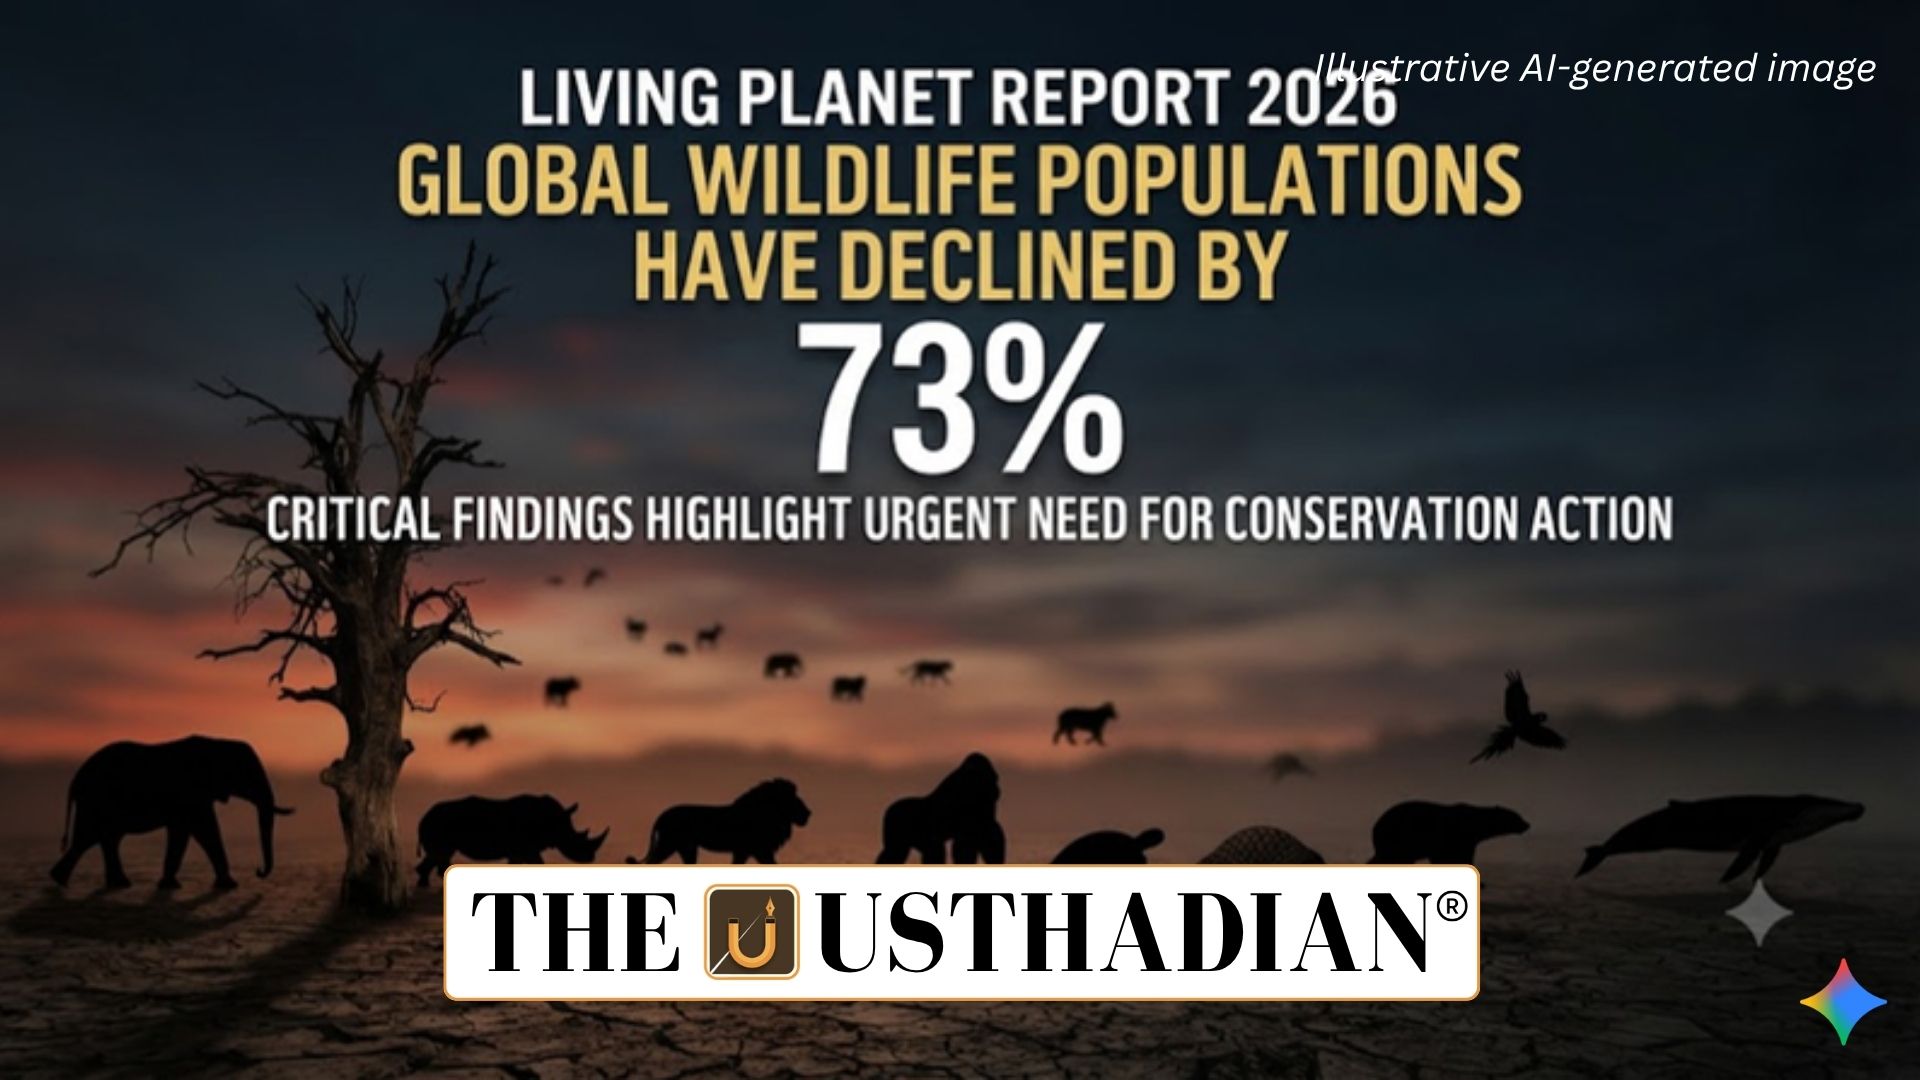
WWF Living Planet Report 2026 Highlights 73% Wildlife Population Decline: The World Wide Fund for Nature (WWF) Living Planet Report 2026 highlights a major decline in global biodiversity. The report records an average 73% decline in monitored wildlife populations between 1970 and 2022, based on the Living Planet Index (LPI) compiled by the Zoological Society of London (ZSL).
The assessment covers 35,803 population trends across 5,790 vertebrate species. Compared with the 2024 index, the dataset includes approximately 1,000 additional population trends and nearly 300 more species.
Static GK fact: WWF was established in 1961. Its international conservation work focuses on protecting biodiversity and reducing humanity’s environmental footprint.
Understanding the Living Planet Index
The Living Planet Index measures changes in the abundance of monitored vertebrate populations over time. It helps assess the condition of biodiversity and provides an early warning of ecological pressures.
The reported 73% decline does not mean that 73% of all wild animals have disappeared or that 73% of species have become extinct. It represents the average decline in the monitored populations included in the index.
Static GK Tip: The LPI tracks population abundance trends, whereas species extinction statistics measure the loss of species.
Freshwater Ecosystems Face the Sharpest Decline
The report identifies freshwater ecosystems as the most severely affected among the three major ecosystem categories.
- Freshwater ecosystems: 85% decline
- Terrestrial ecosystems: 69% decline
- Marine ecosystems: 59% decline
Major pressures on freshwater biodiversity include habitat alteration, pollution, overexploitation, changes in water flows, invasive species and climate change.
Major Drivers of Biodiversity Loss
Habitat loss and degradation are identified as the most frequently reported pressures affecting monitored wildlife populations. Other major drivers include overexploitation, climate change, pollution, invasive species and disease.
The report links these pressures to wider economic systems, particularly food production, energy and finance. Unsustainable agricultural practices and consumption patterns can intensify pressure on land and water resources.
The report also highlights an annual US$1.3 trillion biodiversity financing gap. Financial institutions can support conservation by accounting for nature-related risks and redirecting investment away from environmentally harmful activities.
Positive Tipping Points and System Transformation
A tipping point is a threshold beyond which a system can shift into a different state. A positive tipping point occurs when change accelerates towards a more sustainable condition and reinforces further progress.
The report discusses three major systems:
- Energy: Clean-energy transitions have passed positive tipping points in some regions.
- Food and agriculture: Promising changes are emerging, but further transformation is needed.
- Finance: Progress remains at an early stage, requiring faster changes in investment flows.
Conservation Successes Offer Hope
Despite the overall decline, the report notes that 50% of the populations included in the index are stable or increasing. Examples of wildlife recovery include green turtles, bluefin tuna, tigers and southern African elephants.
These cases demonstrate that conservation, habitat restoration and reduced threats can help populations recover. However, conservation programmes must be supported by broader changes in the systems driving biodiversity loss.
International Frameworks and Biodiversity Targets
The report connects its recommendations with the Kunming-Montreal Global Biodiversity Framework (KMGBF) and the Paris Agreement.
The KMGBF was adopted at the 15th Conference of the Parties (COP15) to the Convention on Biological Diversity in 2022. It sets global goals to halt and reverse biodiversity loss by 2030, alongside longer-term targets for 2050.
Achieving these objectives requires effective implementation, greater investment, political commitment and changes in food, energy and financial systems.
Static Usthadian Current Affairs Table
WWF Living Planet Report 2026 Highlights 73% Wildlife Population Decline:
| Fact | Detail |
| Report | WWF Living Planet Report 2026 |
| Index | Living Planet Index |
| Index compiler | Zoological Society of London |
| Monitoring period | 1970–2022 |
| Average monitored population decline | 73% |
| Population trends covered | 35,803 |
| Vertebrate species covered | 5,790 |
| Highest ecosystem decline | Freshwater – 85% |
| Annual biodiversity financing gap | US$1.3 trillion |
| Global biodiversity framework | Kunming-Montreal Global Biodiversity Framework |
| Framework adopted | COP15, 2022 |
| Major climate agreement | Paris Agreement |