
PM2.5 Pollution: What’s at Stake for India’s Cities
Air Quality Report 2025: Where India Is Winning the Pollution Fight — and Where It’s Not: Air pollution in India isn’t just about hazy skylines — it’s a major public health emergency. The 2025 Air Quality Report by Respirer Living Sciences shows that while average PM2.5 levels fell 27% nationally between 2019 and 2024, many cities still exceed safe limits. PM2.5 particles are extremely small and can enter the lungs and bloodstream, leading to asthma, heart disease, and premature death. The WHO recommends a PM2.5 level below 5 µg/m³, but some Indian cities are far above this mark.
Who’s Breathing Better: India’s Top Clean-Air Cities
Some cities have shown what success looks like. Varanasi reduced PM2.5 levels by 76%, an outstanding achievement. Other clean-air champions include:
- Moradabad – 58% reduction
- Kalaburagi – 57.2%
- Meerut – 57.1%
These gains came from localized action: electrified transport, street dust control, banning open waste burning, and regular air quality monitoring. Varanasi’s transformation proves that targeted efforts can bring dramatic improvements.
Pollution Hotspots: The Cities Still in Crisis
Despite the good news, some cities remain deeply polluted:
- Byrnihat (Assam) – 127.3 µg/m³ (India’s highest)
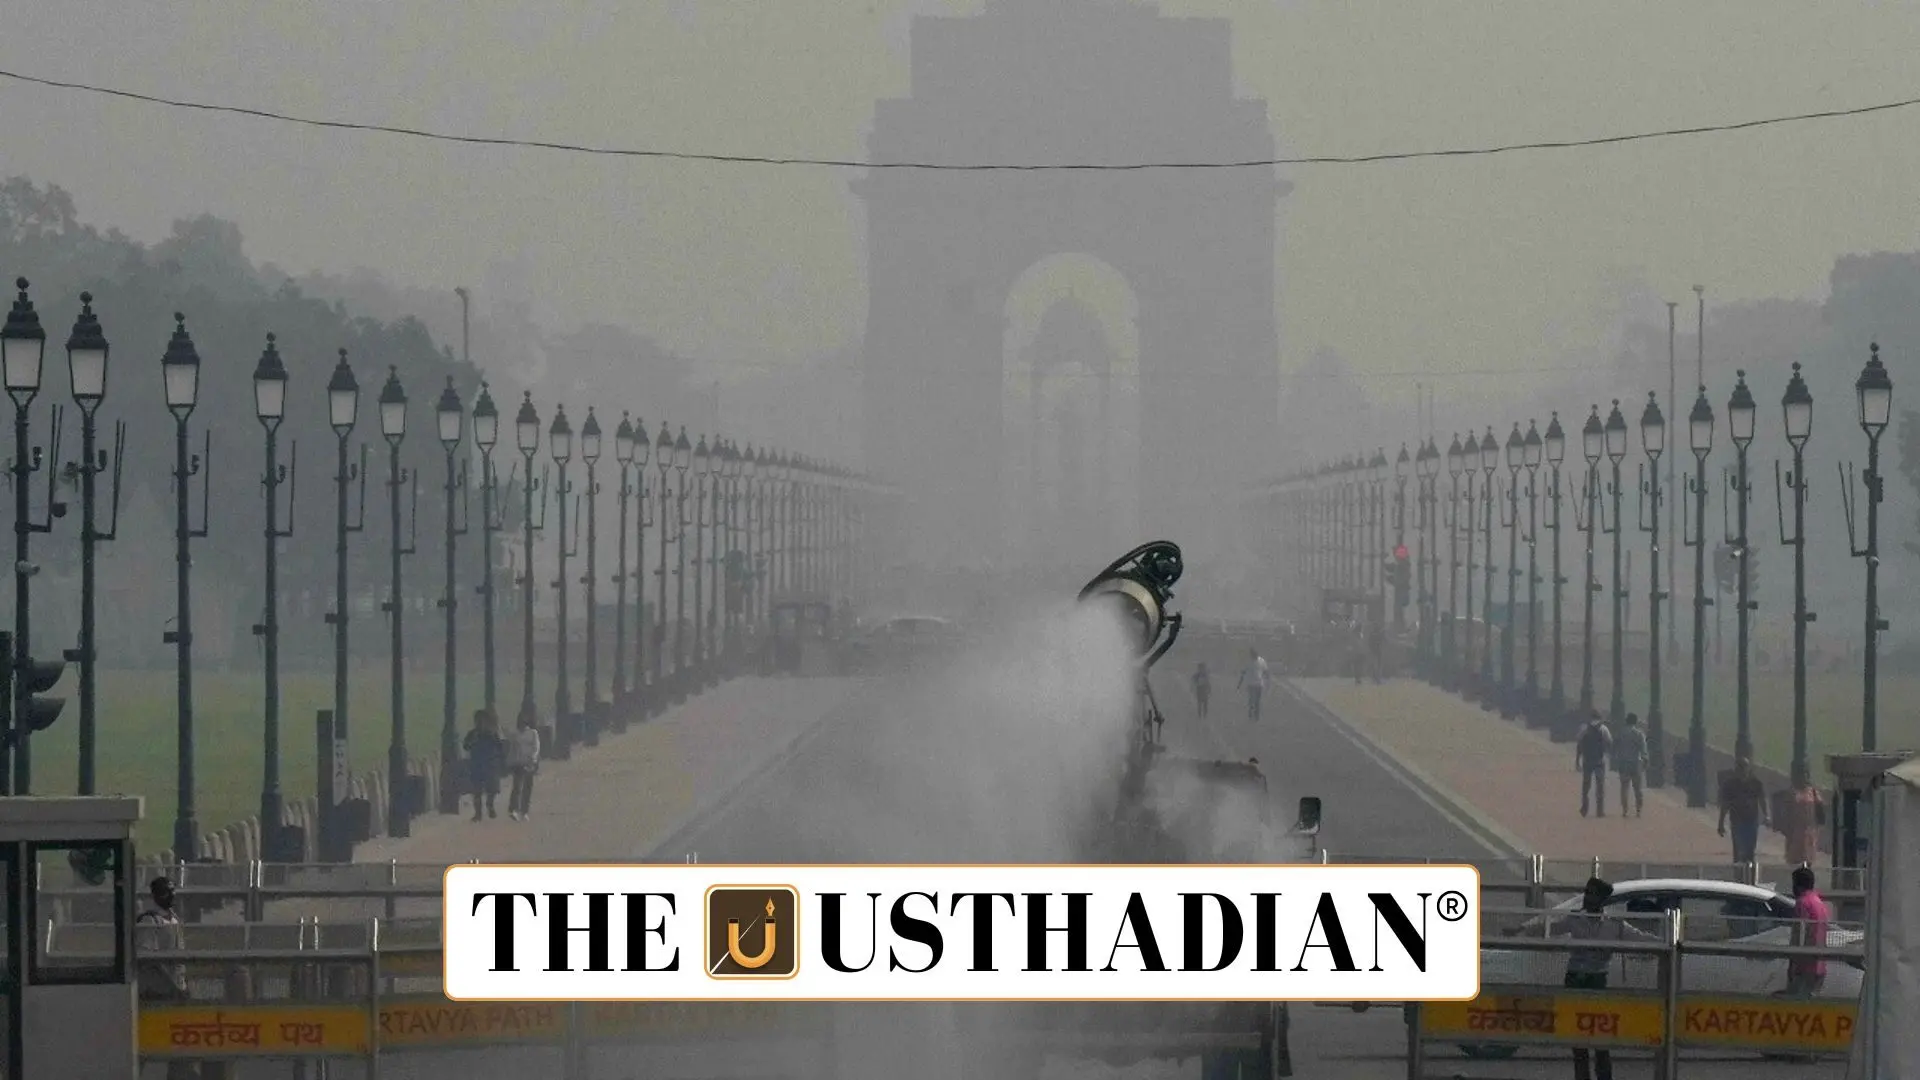
- Delhi – 107 µg/m³
- Gurugram – 96.7 µg/m³
- Faridabad – 87.1 µg/m³
These figures are 20 times higher than WHO limits. In Delhi, seasonal stubble burning, traffic congestion, and construction dust continue to choke the air. In Byrnihat, industrial pollution and weak regulations make improvement difficult.
NCAP: India’s Main Strategy to Clean the Air
The National Clean Air Programme (NCAP), launched in 2019, initially aimed to reduce PM pollution by 20–30% by 2024 (using 2017 as the base year). In 2023, this target was revised to a 40% reduction by 2026. The NCAP pushes for:
- Cleaner fuels and fuel transition policies
- Urban planning and green public transport
- Expanded air monitoring networks
- Industrial pollution control and enforcement
While it provides a framework, its implementation has varied, which explains the regional disparities in air quality progress.
STATIC GK SNAPSHOT FOR COMPETITIVE EXAMS
| Topic | Fact |
| PM2.5 Definition | Particulate Matter < 2.5 micrometers; causes respiratory illness |
| WHO Safe PM2.5 Limit | 5 µg/m³ annually |
| NCAP Launch Year | 2019 |
| Original NCAP Target | 20–30% PM2.5 reduction by 2024 |
| Revised NCAP Target | 40% PM2.5 reduction by 2026 |
| Top Performing City | Varanasi – 76% PM2.5 reduction (2019–24) |
| Worst PM2.5 City in 2024 | Byrnihat (Assam) – 127.3 µg/m³ |
| Cities Showing Major Improvements | Kalaburagi, Moradabad, Meerut |
| Reasons for Air Quality Drop | Cleaner fuels, transport reforms, bans on open waste burning |
| Key Causes of Pollution | Vehicle emissions, industrial smoke, crop burning, construction dust |